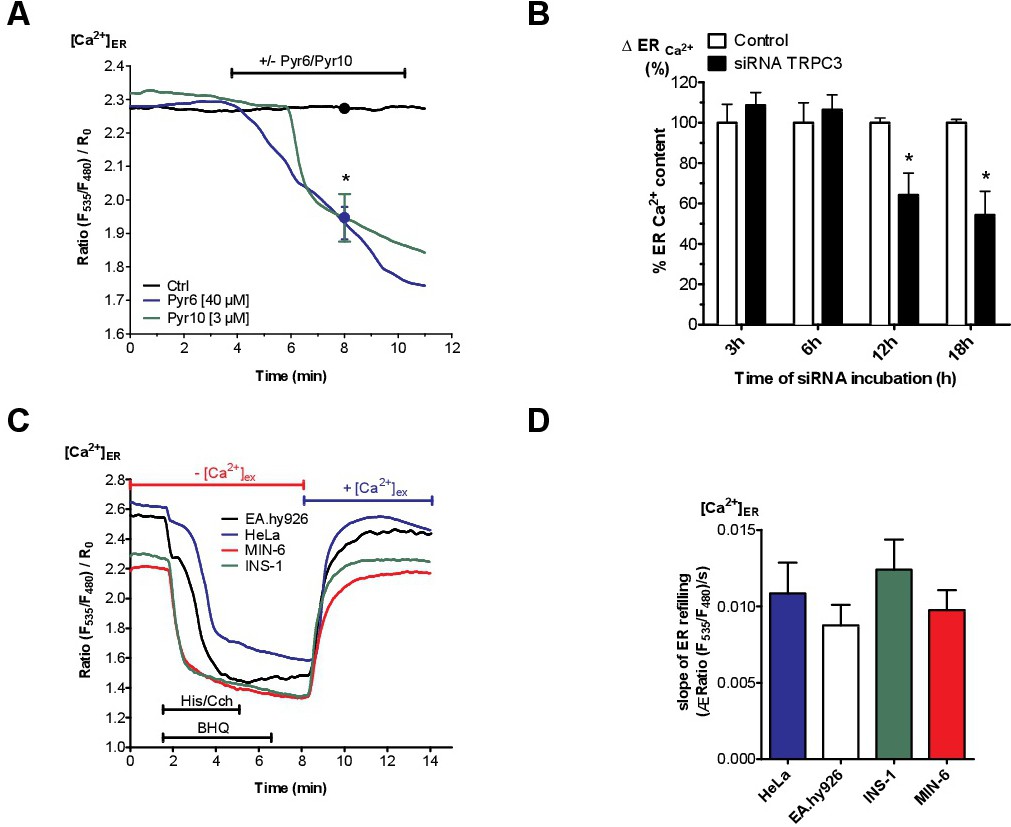
Fig. 4. Enhanced ER Ca2+ loss in β-cells is compensated by TRPC3-associated Ca2+ entry. (A) Curves for β-cells (depicted INS-1) reflect [Ca2+]ER ratio signals over time measured with D1ER in experimental buffer containing 2 mM Ca2+ under control conditions (black curve), with the TRPC3 inhibitor Pyr6 (40 µM) (blue curve) or Pyr10 (3 µM) (green curve) (n ≥ 6). (B) Percentage of ER Ca2+ content under Ca2+-free conditions in INS-1 cells under control conditions (white bars) or 3, 6, 12 or 18 h after transfection with specific siRNA against of TRPC3 (white bars). ER Ca2+ content was measured by applying the SERCA inhibitor BHQ (15 µM), together with carbachol (100 µM). The corresponding 1 min control values were set to 100%. *p<0.05, tested with one-way ANOVA (n=6). (C) Representative traces and respective statistic (D) illustrating [Ca2+]ER over time in HeLa (blue line), EA.hy926 (black line), INS-1 (green line) and MIN-6 (red line) cells, measured by D1ER (Data extracted from D). ER Ca2+ store was depleted using 100 µM histamine (His) for HeLa and EA.hy926 or 100 µM carbachol (Cch) for INS-1 and MIN-6 together with 15 µM BHQ in Ca2+-free EGTA-buffered solution. To compare SERCA activity between the cell lines, external Ca2+ (2 mM) was added after agonists were washed out. Bars on the right represent corresponding statistics (n ≥ 6).